Working smarter with dplyr 1.2.0

R-Ladies Rome | Isabella Velásquez

Introduction

@ivelasq3

@ivelasq

@ivelasq

ivelasq.rbind.io

Introduction

⬢ Slides available at: https://ivelasq-dplyr-1-2-0.share.connect.posit.cloud

⬢ Links available at the end of the slide deck

Today’s data

Salmonid Mortality Data from TidyTuesday

⬢ Salmonid mortality datasets published by the Norwegian Veterinary Institute

⬢ Two datasets are shared, the monthly mortality data, and the monthly loses data

⬢ Data from 2020

Today’s data

monthly_losses_data

monthly_losses_data <-
  readr::read_csv('https://raw.githubusercontent.com/rfordatascience/tidytuesday/main/data/2026/2026-03-17/monthly_losses_data.csv')

head(monthly_losses_data)
# A tibble: 6 × 9
  species date       geo_group region losses   dead discarded escaped other
  <chr>   <date>     <chr>     <chr>   <dbl>  <dbl>     <dbl>   <dbl> <dbl>
1 salmon  2020-01-01 area      1       31425  28126      3299       0     0
2 salmon  2020-01-01 area      2      324116 277888     46113       0   115
3 salmon  2020-01-01 area      3      844829 776983     63770       0  4076
4 salmon  2020-01-01 area      4      676852 623159     51823       0  1870
5 salmon  2020-01-01 area      5      109269  97627     11424       0   218
6 salmon  2020-01-01 area      6      548921 531193     15710       0  2018

dplyr

dplyr is a grammar of data manipulation, providing a consistent set of verbs that help you solve the most common data manipulation challenges

Quick review of dplyr functions

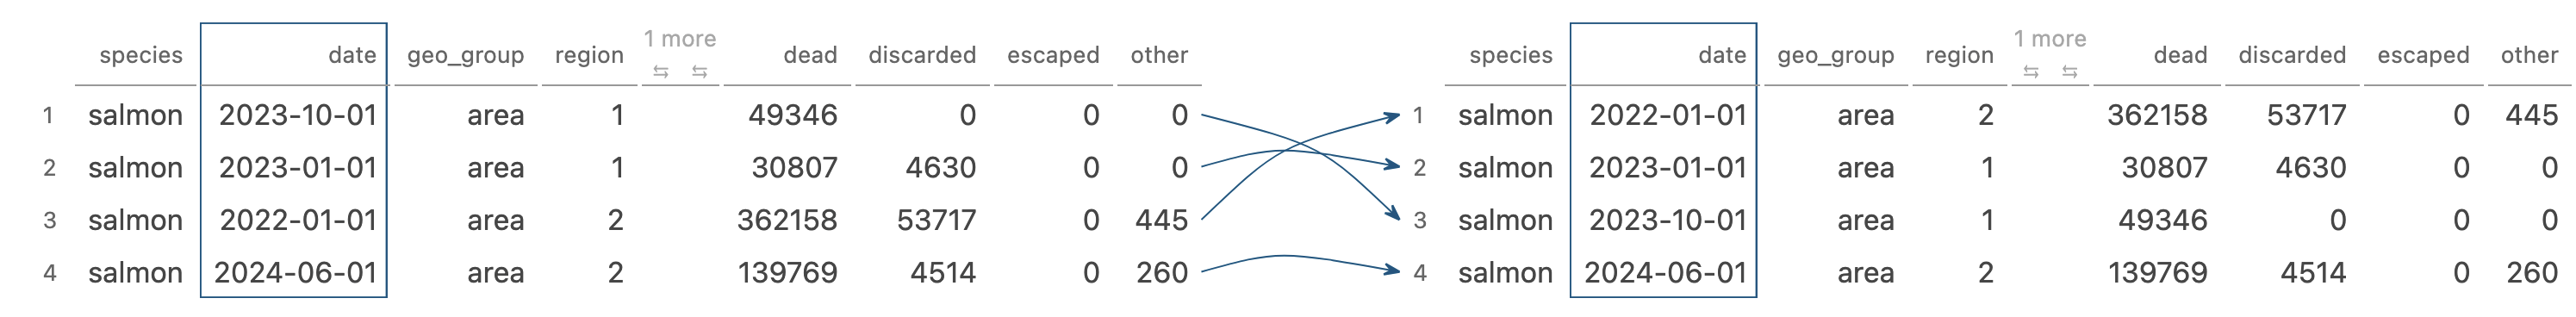
arrange() changes the ordering of the rows

monthly_losses_data |> 
  arrange(date)

Quick review of dplyr functions

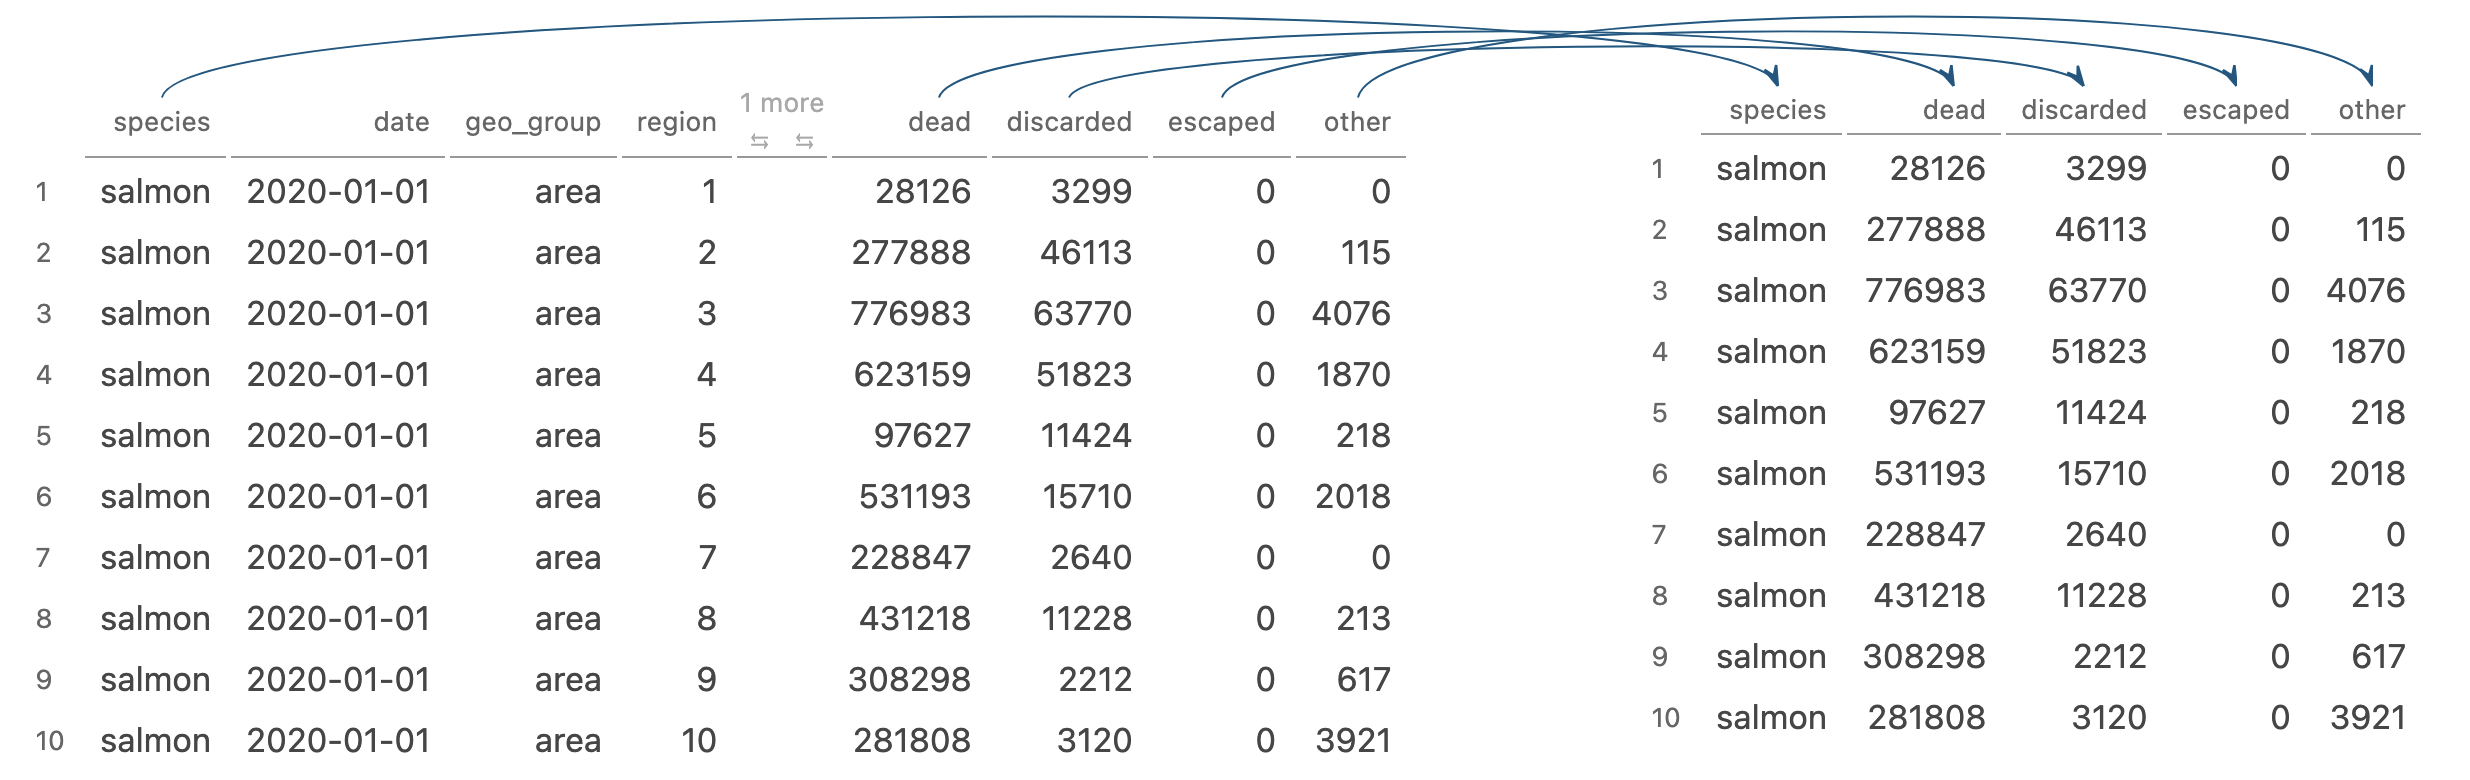
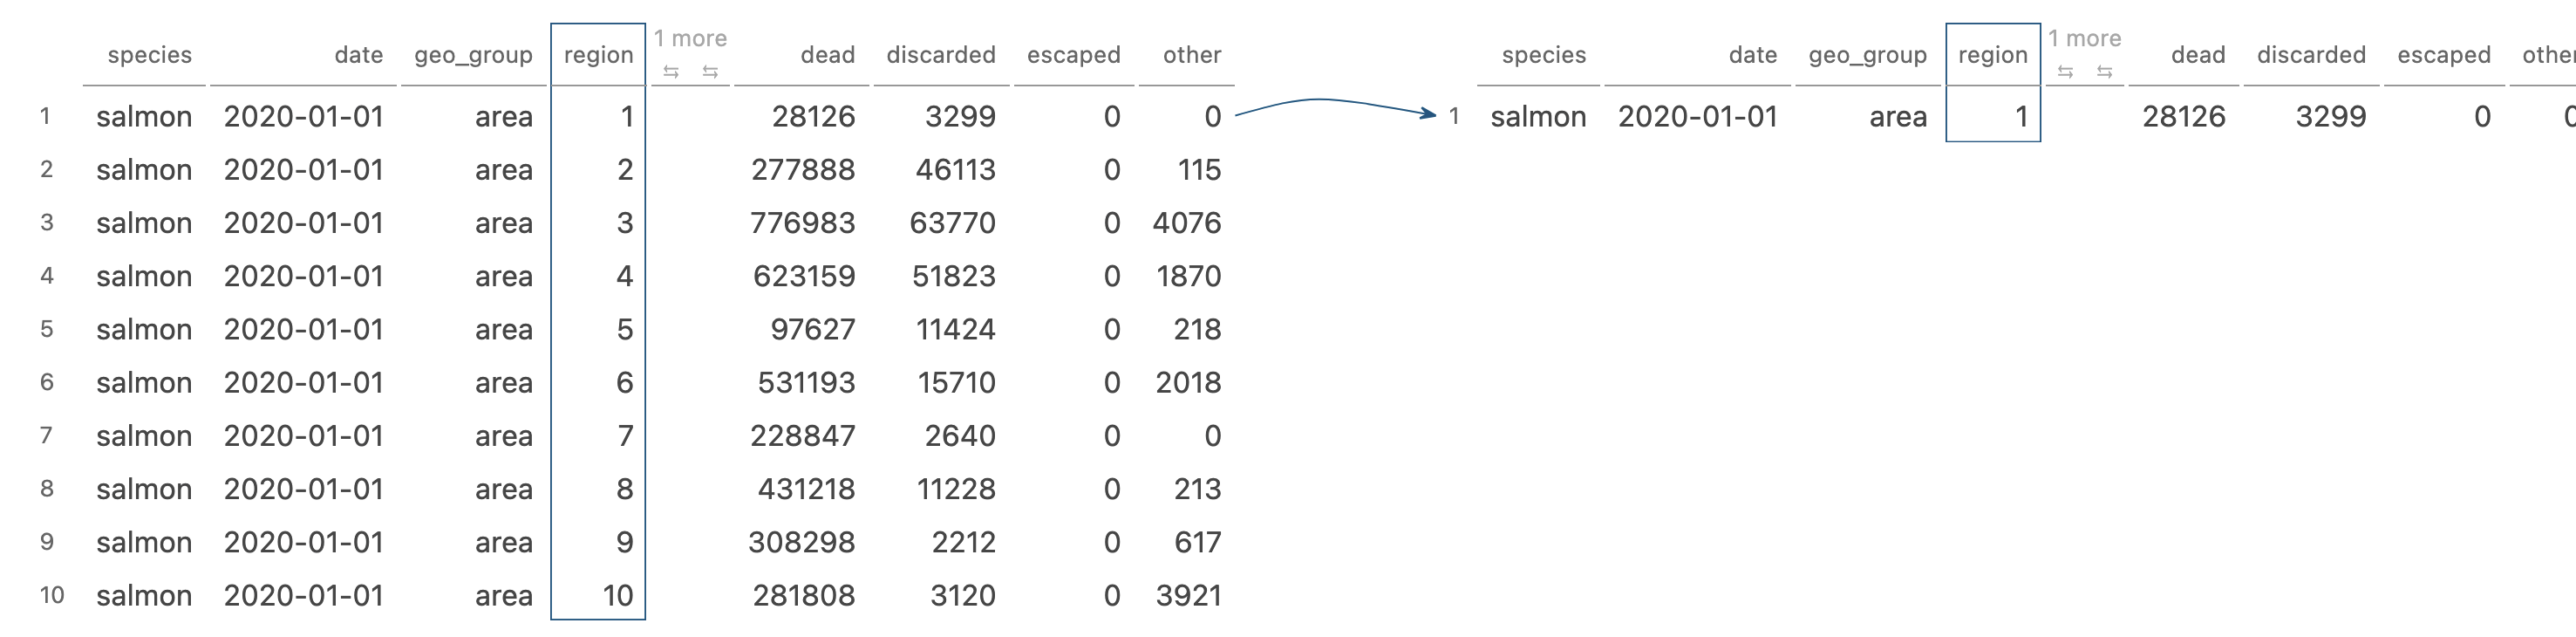
select() picks variables based on their names

monthly_losses_data |> 
  select(species, dead, discarded, escaped, other)

Quick review of dplyr functions

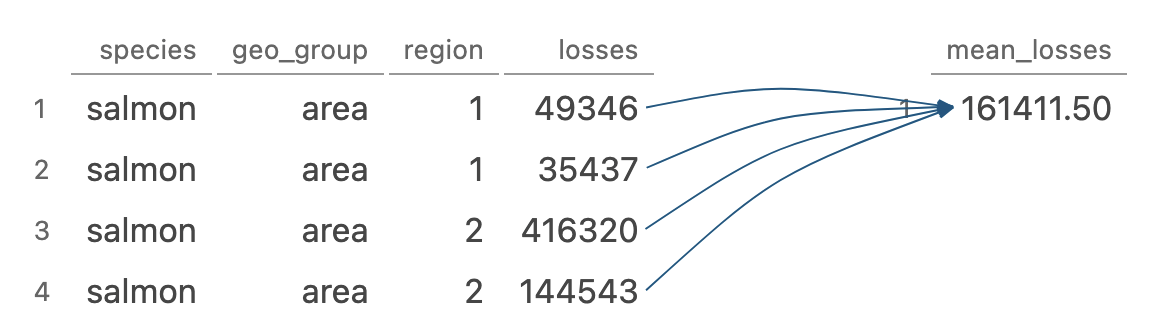
summarise()/summarize() reduces multiple values down to a single summary

monthly_losses_data |> 
  summarize(mean_losses = mean(losses)) 

Quick review of dplyr functions

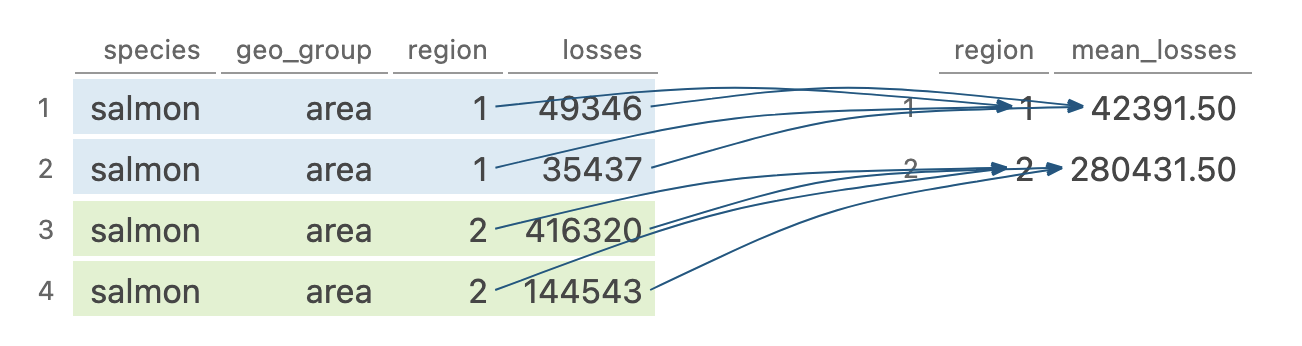
group_by() allows you to perform any operation “by group”

monthly_losses_data |> 
  group_by(region) |> 
  summarize(mean = mean(losses))

Quick review of dplyr functions

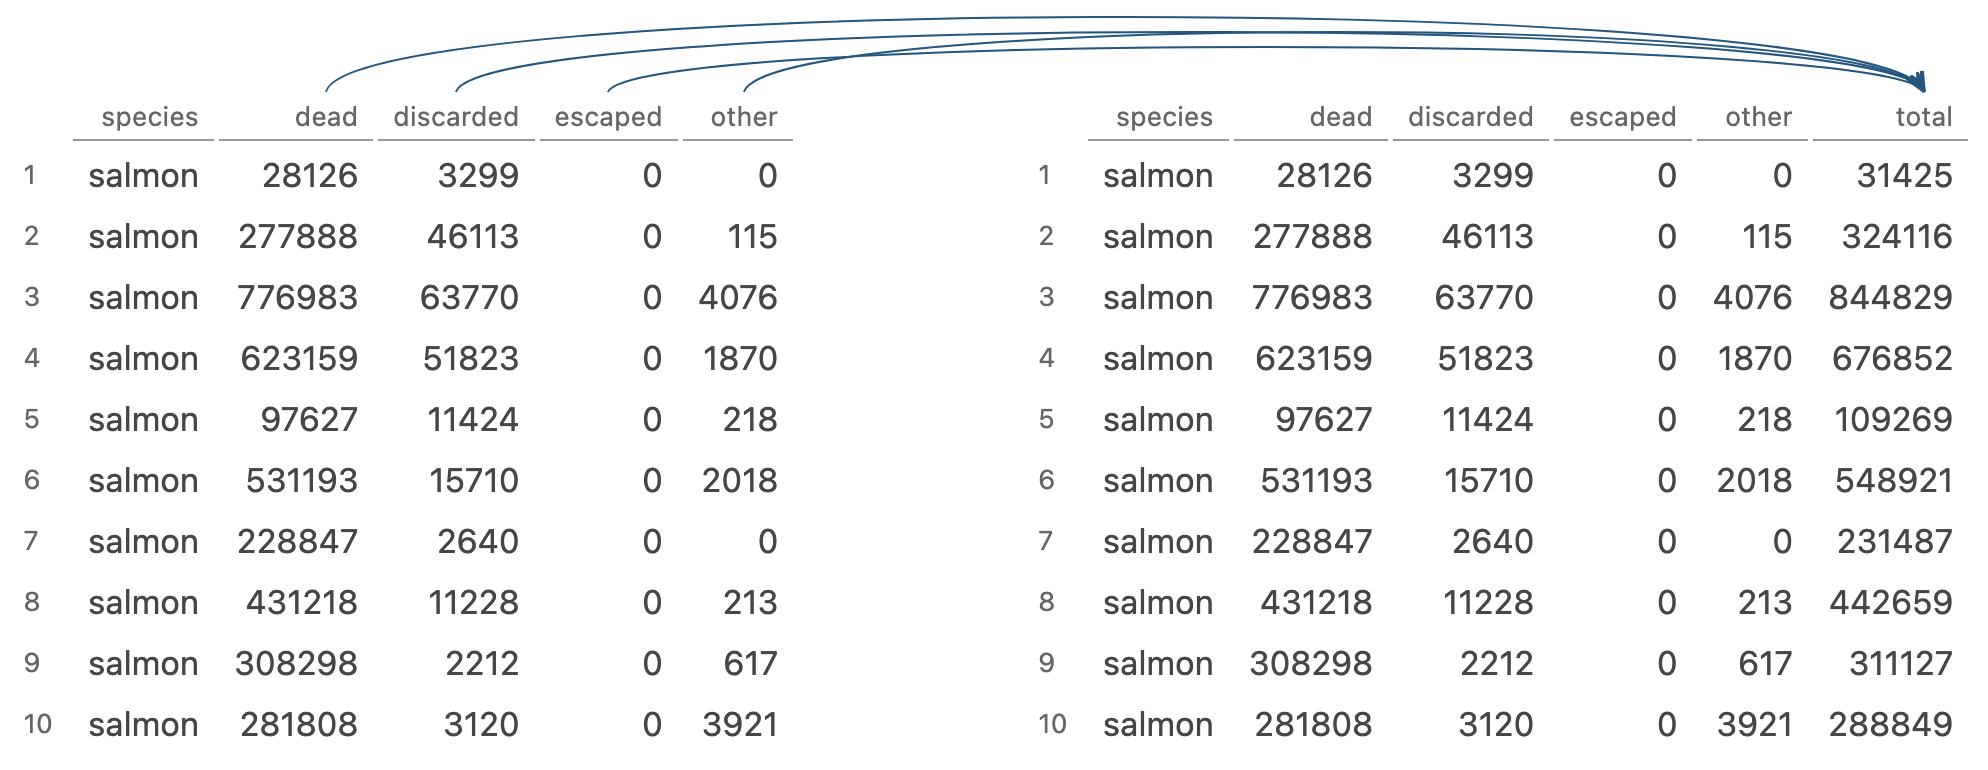
mutate() adds new variables that are functions of existing variables

monthly_losses_data |> 
    mutate(total = dead + discarded + escaped + other)

Quick review of dplyr functions

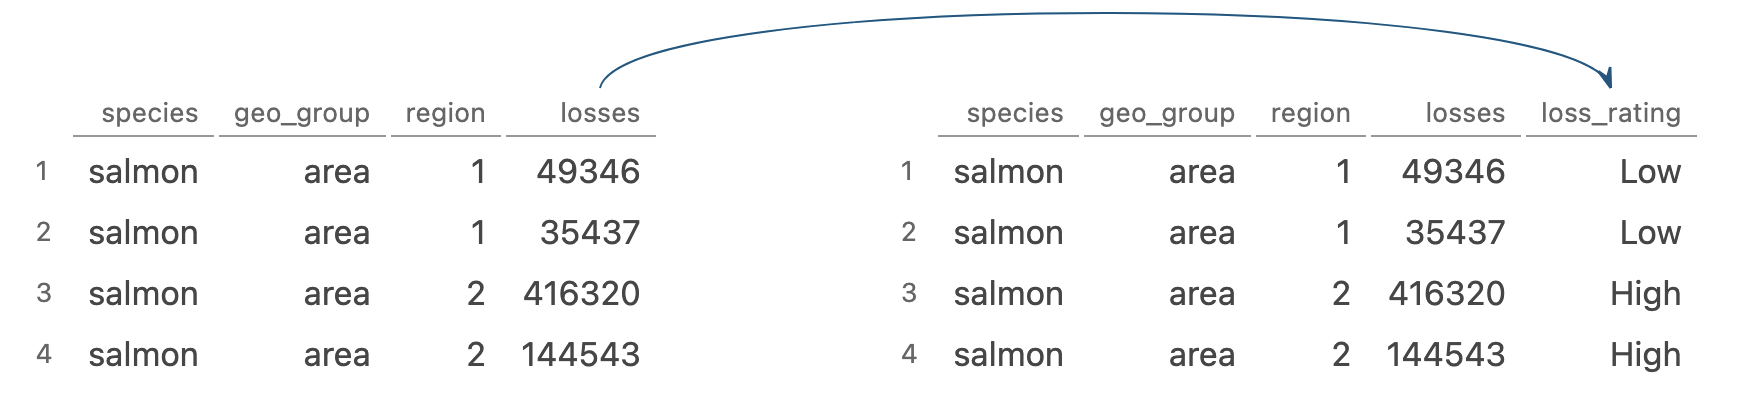
case_when() checks each condition in order and uses the first match to determine the value of a new variable

monthly_losses_data |>
  mutate(loss_rating = 
           case_when(losses > 100000 ~ "High", 
                     losses < 100000 ~ "Low")
         )

Quick review of dplyr functions

filter() picks cases based on their values

monthly_losses_data |> 
  filter(region == "1")

Quick review of dplyr functions

So many helpful functions!

distinct()

slice()

count()

pull()

relocate()

rename()

*_join()

⬢ …

But for now, let’s focus on:

filter()

mutate() + case_when()

dplyr 1.2.0

filter_out()

The problem with using filter() to exclude

monthly_losses_data |> 
  filter(region == "1")

is a little ambiguous! Are you keeping (filtering in) Region 1 or dropping (filtering out) Region 1?


filter() is optimized for the case of keeping rows, but using it for dropping rows can require complex logic

The problem with using filter() to exclude

Let’s look at this sample dataset:

monthly_losses_NA
# A tibble: 5 × 3
  species region losses
  <chr>   <chr>   <dbl>
1 salmon  1       31425
2 salmon  2      324116
3 salmon  3      844829
4 salmon  3      676852
5 salmon  3          NA

The problem with using filter() to exclude

Drop rows where region is 3 and losses are greater than 700,000.

monthly_losses_NA
# A tibble: 5 × 3
  species region losses
  <chr>   <chr>   <dbl>
1 salmon  1       31425
2 salmon  2      324116
3 salmon  3      844829
4 salmon  3      676852
5 salmon  3          NA

The problem with using filter() to exclude

Drop rows where region is 3 and losses are greater than 700,000. (In this case, Row 3)

monthly_losses_NA |> 
  filter(!(region == 3 & losses > 700000))
# A tibble: 3 × 3
  species region losses
  <chr>   <chr>   <dbl>
1 salmon  1       31425
2 salmon  2      324116
3 salmon  3      676852

The problem with using filter() to exclude

Oh no! What happened to our row with NA under losses?

Pre-filter:

# A tibble: 5 × 3
  species region losses
  <chr>   <chr>   <dbl>
1 salmon  1       31425
2 salmon  2      324116
3 salmon  3      844829
4 salmon  3      676852
5 salmon  3          NA

Post-filter:

# A tibble: 3 × 3
  species region losses
  <chr>   <chr>   <dbl>
1 salmon  1       31425
2 salmon  2      324116
3 salmon  3      676852

Using filter() to exclude rows also drops NAs!

The problem with using filter() to exclude

To properly use filter(), we would need to do something like:

monthly_losses_NA |> 
  filter(
    !((region == 3 & !is.na(region)) & 
             (losses > 700000 & !is.na(losses)))
    )
# A tibble: 4 × 3
  species region losses
  <chr>   <chr>   <dbl>
1 salmon  1       31425
2 salmon  2      324116
3 salmon  3      676852
4 salmon  3          NA

Work smarter with dplyr 1.2.0!

New filter_out() function

Use…

filter() to keep rows

filter_out() to drop rows

Work smarter with filter_out()

Now, we just have to run:

monthly_losses_NA |> 
  filter_out(region == 3 & losses > 700000)
# A tibble: 4 × 3
  species region losses
  <chr>   <chr>   <dbl>
1 salmon  1       31425
2 salmon  2      324116
3 salmon  3      676852
4 salmon  3          NA

when_any() and when_all()

Issues with using filter() and |

Let’s look at this sample dataset:

monthly_losses_filters
# A tibble: 8 × 3
# Groups:   region [4]
  species region losses
  <chr>   <chr>   <dbl>
1 salmon  2      324116
2 salmon  2      197239
3 salmon  7      231487
4 salmon  7      475115
5 salmon  8      442659
6 salmon  8      327323
7 salmon  9      311127
8 salmon  9      286601

Issues with using filter() and |

Keep rows where region 7 or 8 have losses over 400,000 OR and where regions 2 or 9 have losses over 300,000.

monthly_losses_filters
# A tibble: 8 × 3
# Groups:   region [4]
  species region losses
  <chr>   <chr>   <dbl>
1 salmon  2      324116
2 salmon  2      197239
3 salmon  7      231487
4 salmon  7      475115
5 salmon  8      442659
6 salmon  8      327323
7 salmon  9      311127
8 salmon  9      286601

Issues with using filter() and |

Keep rows where region 7 or 8 have losses over 400,000 OR and where regions 2 or 9 have losses over 300,000. In this case, Rows 1, 4, 5, and 7)

monthly_losses_filters |> 
  filter(
    (region %in% c("7", "8") & losses > 400000) |
           (region %in% c("2", "9") & losses > 300000)
    )
# A tibble: 4 × 3
# Groups:   region [4]
  species region losses
  <chr>   <chr>   <dbl>
1 salmon  2      324116
2 salmon  7      475115
3 salmon  8      442659
4 salmon  9      311127

Work smarter with dplyr 1.2.0!

New when_any() and when_all() functions

Use…

when_any() to specify “or” conditions

when_all() to specify “all” conditions

Work smarter with filter() + when_any()

monthly_losses_filters |>
  filter(
    when_any(
      (region %in% c("7", "8") & losses > 400000),
      (region %in% c("2", "9") & losses > 300000)
    )
  )
# A tibble: 4 × 3
# Groups:   region [4]
  species region losses
  <chr>   <chr>   <dbl>
1 salmon  2      324116
2 salmon  7      475115
3 salmon  8      442659
4 salmon  9      311127

Work smarter with filter() + when_all()

monthly_losses_filters |>
  filter(
    when_all(
      region %in% c("7", "8"),
      losses > 400000
    )
  )
# A tibble: 2 × 3
# Groups:   region [2]
  species region losses
  <chr>   <chr>   <dbl>
1 salmon  7      475115
2 salmon  8      442659

New recoding functions

Recoding has always been a pain

Recoding with case_when()

monthly_losses_data |>
  select(species, geo_group, region, losses) |>
  filter(geo_group == "area") |>
  mutate(
    production_area =
      case_when(
        region == "1" ~ "Jæren",
        region == "2" ~ "Ryfylke",
        region == "3" ~ "Sotra",
        region == "4" ~ "Stadt",
        region == "5" ~ "Hustadvika",
        region == "6" ~ "Nordmøre",
        region == "7" ~ "Nord-Trøndelag",
        region == "8" ~ "Bodø",
        region == "9" ~ "Vestlfjorden",
        region == "10" ~ "Andfjorden",
        region == "11" ~ "Kvaløya",
        region == "12" ~ "Vest-Finnmark",
        region == "13" ~ "Øst-Finnmark",
        .default = NA_character_
      )
  )

Recoding with case_when()

# A tibble: 1,512 × 5
   species geo_group region losses production_area
   <chr>   <chr>     <chr>   <dbl> <chr>          
 1 salmon  area      1       31425 Jæren          
 2 salmon  area      2      324116 Ryfylke        
 3 salmon  area      3      844829 Sotra          
 4 salmon  area      4      676852 Stadt          
 5 salmon  area      5      109269 Hustadvika     
 6 salmon  area      6      548921 Nordmøre       
 7 salmon  area      7      231487 Nord-Trøndelag 
 8 salmon  area      8      442659 Bodø           
 9 salmon  area      9      311127 Vestlfjorden   
10 salmon  area      10     288849 Andfjorden     
# ℹ 1,502 more rows

Recoding with recode()

monthly_losses_data |>
  select(species, geo_group, region, losses) |>
  filter(geo_group == "area") |>
  mutate(
    production_area =
      recode(
        region,
        "1" = "Jæren",
        "2" = "Ryfylke",
        "3" = "Sotra",
        "4" = "Stadt",
        "5" = "Hustadvika",
        "6" = "Nordmøre",
        "7" = "Nord-Trøndelag",
        "8" = "Bodø",
        "9" = "Vestlfjorden",
        "10" = "Andfjorden",
        "11" = "Kvaløya",
        "12" = "Vest-Finnmark",
        "13" = "Øst-Finnmark",
        .default = NA_character_
      )
  )

Recoding with recode()

# A tibble: 1,512 × 5
   species geo_group region losses production_area
   <chr>   <chr>     <chr>   <dbl> <chr>          
 1 salmon  area      1       31425 Jæren          
 2 salmon  area      2      324116 Ryfylke        
 3 salmon  area      3      844829 Sotra          
 4 salmon  area      4      676852 Stadt          
 5 salmon  area      5      109269 Hustadvika     
 6 salmon  area      6      548921 Nordmøre       
 7 salmon  area      7      231487 Nord-Trøndelag 
 8 salmon  area      8      442659 Bodø           
 9 salmon  area      9      311127 Vestlfjorden   
10 salmon  area      10     288849 Andfjorden     
# ℹ 1,502 more rows

Recoding with recode() + rlang

Say we map our areas to production areas (POs):

po_mapping <- list(
  "1" = "Jæren",
  "2" = "Ryfylke",
  "3" = "Sotra",
  "4" = "Stadt",
  "5" = "Hustadvika",
  "6" = "Nordmøre",
  "7" = "Nord-Trøndelag",
  "8" = "Bodø",
  "9" = "Vestlfjorden",
  "10" = "Andfjorden",
  "11" = "Kvaløya",
  "12" = "Vest-Finnmark",
  "13" = "Øst-Finnmark"
)

Recoding with recode() + rlang

We can use rlang’s !!! to splice the list and use it in recode():

monthly_losses_data |>
  select(species, geo_group, region, losses) |> 
  filter(geo_group == "area") |>
  mutate(production_area = 
           recode(region, 
                  !!!po_mapping, 
                  .default = NA_character_)
         )

Recoding with recode() + rlang

# A tibble: 1,512 × 5
   species geo_group region losses production_area
   <chr>   <chr>     <chr>   <dbl> <chr>          
 1 salmon  area      1       31425 Jæren          
 2 salmon  area      2      324116 Ryfylke        
 3 salmon  area      3      844829 Sotra          
 4 salmon  area      4      676852 Stadt          
 5 salmon  area      5      109269 Hustadvika     
 6 salmon  area      6      548921 Nordmøre       
 7 salmon  area      7      231487 Nord-Trøndelag 
 8 salmon  area      8      442659 Bodø           
 9 salmon  area      9      311127 Vestlfjorden   
10 salmon  area      10     288849 Andfjorden     
# ℹ 1,502 more rows

Work smarter with dplyr 1.2.0!

Recoding vs replacing

recoding is creating an entirely new column using values from an existing column

replacing is partially updating an existing column with new values

New recoding and replacing functions

Recall case_when():

monthly_losses_data |>
  slice(1:4) |> 
  select(species, region, losses) |> 
  mutate(loss_rating = 
           case_when(losses > 100000 ~ "High", 
                     losses < 100000 ~ "Low")
         )
# A tibble: 4 × 4
  species region losses loss_rating
  <chr>   <chr>   <dbl> <chr>      
1 salmon  1       31425 Low        
2 salmon  2      324116 High       
3 salmon  3      844829 High       
4 salmon  4      676852 High       

New recoding and replacing functions

Three new functions to join the case_when() family. Use:

case_when() when recoding and matching with conditions

recode_values() when recoding and matching with values

replace_when() when replacing and matching with conditions

replace_values() when replacing and matching with values

New recode_values() function

Recall that our region is a value and we would like to recode our dataset

monthly_losses_data |>
  select(species, geo_group, region, losses) |>
  filter(geo_group == "area") |>
  mutate(
    production_area = region |> 
      recode_values(
        "1" ~ "Jæren",
        "2" ~ "Ryfylke",
        "3" ~ "Sotra",
        "4" ~ "Stadt",
        "5" ~ "Hustadvika",
        "6" ~ "Nordmøre",
        "7" ~ "Nord-Trøndelag",
        "8" ~ "Bodø",
        "9" ~ "Vestlfjorden",
        "10" ~ "Andfjorden",
        "11" ~ "Kvaløya",
        "12" ~ "Vest-Finnmark",
        "13" ~ "Øst-Finnmark"
      )
  )

New recode_values() function

Recall that our region is a value and we would like to recode our dataset

monthly_losses_data |>
  select(species, geo_group, region, losses) |>
  filter(geo_group == "area") |>
  mutate(
    production_area = region |> 
      recode_values(
        "1" ~ "Jæren",
        "2" ~ "Ryfylke",
        "3" ~ "Sotra",
        "4" ~ "Stadt",
        "5" ~ "Hustadvika",
        "6" ~ "Nordmøre",
        "7" ~ "Nord-Trøndelag",
        "8" ~ "Bodø",
        "9" ~ "Vestlfjorden",
        "10" ~ "Andfjorden",
        "11" ~ "Kvaløya",
        "12" ~ "Vest-Finnmark",
        "13" ~ "Øst-Finnmark",
        unmatched = "error"
      )
  )

New recode_values() function

# A tibble: 1,512 × 5
   species geo_group region losses production_area
   <chr>   <chr>     <chr>   <dbl> <chr>          
 1 salmon  area      1       31425 Jæren          
 2 salmon  area      2      324116 Ryfylke        
 3 salmon  area      3      844829 Sotra          
 4 salmon  area      4      676852 Stadt          
 5 salmon  area      5      109269 Hustadvika     
 6 salmon  area      6      548921 Nordmøre       
 7 salmon  area      7      231487 Nord-Trøndelag 
 8 salmon  area      8      442659 Bodø           
 9 salmon  area      9      311127 Vestlfjorden   
10 salmon  area      10     288849 Andfjorden     
# ℹ 1,502 more rows

Using recode_values() and a lookup table

Let’s create a lookup table from our list:

po_mapping_tibble <- 
  tibble::enframe(po_mapping, name = "from", value = "to") |> 
  unnest(to)

po_mapping_tibble
# A tibble: 13 × 2
   from  to            
   <chr> <chr>         
 1 1     Jæren         
 2 2     Ryfylke       
 3 3     Sotra         
 4 4     Stadt         
 5 5     Hustadvika    
 6 6     Nordmøre      
 7 7     Nord-Trøndelag
 8 8     Bodø          
 9 9     Vestlfjorden  
10 10    Andfjorden    
11 11    Kvaløya       
12 12    Vest-Finnmark 
13 13    Øst-Finnmark  

Using recode_values() and a lookup table

We can use a lookup to recode our values:

monthly_losses_data |>
  select(species, geo_group, region, losses) |>
  filter(geo_group == "area") |>
  mutate(production_area =
           recode_values(region, 
                         from = po_mapping_tibble$from, 
                         to = po_mapping_tibble$to)
         )

Using recode_values() and a lookup table

# A tibble: 1,512 × 5
   species geo_group region losses production_area
   <chr>   <chr>     <chr>   <dbl> <chr>          
 1 salmon  area      1       31425 Jæren          
 2 salmon  area      2      324116 Ryfylke        
 3 salmon  area      3      844829 Sotra          
 4 salmon  area      4      676852 Stadt          
 5 salmon  area      5      109269 Hustadvika     
 6 salmon  area      6      548921 Nordmøre       
 7 salmon  area      7      231487 Nord-Trøndelag 
 8 salmon  area      8      442659 Bodø           
 9 salmon  area      9      311127 Vestlfjorden   
10 salmon  area      10     288849 Andfjorden     
# ℹ 1,502 more rows

New replace_values() function

Using replace_values() to fix some names:

monthly_losses_data_po |>
  mutate(production_area = production_area |> 
           replace_values(
             "Nordmøre" ~ "Nordmøre + Sør-Trøndelag",
             "Nord-Trøndelag" ~ "Nord-Trøndelag + Bindal"
             )
         )

New replace_values() function

# A tibble: 1,512 × 5
   species geo_group region losses production_area         
   <chr>   <chr>     <chr>   <dbl> <chr>                   
 1 salmon  area      1       31425 Jæren                   
 2 salmon  area      2      324116 Ryfylke                 
 3 salmon  area      3      844829 Sotra                   
 4 salmon  area      4      676852 Stadt                   
 5 salmon  area      5      109269 Hustadvika              
 6 salmon  area      6      548921 Nordmøre + Sør-Trøndelag
 7 salmon  area      7      231487 Nord-Trøndelag + Bindal 
 8 salmon  area      8      442659 Bodø                    
 9 salmon  area      9      311127 Vestlfjorden            
10 salmon  area      10     288849 Andfjorden              
# ℹ 1,502 more rows

New replace_when() function

case_when() requires .default, otherwise it will default to NA:

monthly_losses_data |>
  slice(1:4) |> 
  select(species, region, losses) |> 
  mutate(loss_rating = 
           case_when(losses > 500000 ~ 500000,
                     .default = losses
                     )
         )
# A tibble: 4 × 4
  species region losses loss_rating
  <chr>   <chr>   <dbl>       <dbl>
1 salmon  1       31425       31425
2 salmon  2      324116      324116
3 salmon  3      844829      500000
4 salmon  4      676852      500000

New replace_when() function

replace_when() knows you will only replace some of the values, so a .default is not necessary:

monthly_losses_data |>
  slice(1:4) |>
  select(species, region, losses) |>
  mutate(losses = 
           replace_when(losses, 
                        losses > 500000 ~ 500000)
         )
# A tibble: 4 × 3
  species region losses
  <chr>   <chr>   <dbl>
1 salmon  1       31425
2 salmon  2      324116
3 salmon  3      500000
4 salmon  4      500000

Additional thoughts

case_match() has been soft deprecated

Updating your LLM

  • Paste documentation into the conversation
  • Add a CLAUDE.md file to your project
  • Point it to the docs
  • Use an MCP server

Community feedback is sooo important

We are looking for #rstats community feedback on 3 new dplyr functions!

We're aiming to expand the filter() family:

  • filter() to keep rows
  • filter_out() to drop rows
  • when_any() and when_all() as modifiers
Read more and leave feedback here: github.com/tidyverse/ti…

[image or embed]

— Davis Vaughan (@davisvaughan.bsky.social) November 7, 2025 at 10:03 AM

Community feedback is sooo important

Summary

New dplyr 1.2.0 functions

filter_out(), the missing complement to filter(), and accompanying when_any() and when_all() helpers

recode_values(), replace_values(), and replace_when(), three new functions for recoding and replacing

Look out for the upcoming Data Science Lab recording!

Installing dplyr 1.2.0

Upgrade today!

install.packages("pak")
pak::pak("dplyr")

Thank you

Acknowledgements

  • Davis Vaughan and the tidyverse team
  • Libby Heeren for her awesome example
  • Emojis from OpenMoji
  • Photo from Unsplash